Chart type: Line
Line graphs are commonly used to show trends over a period of time. X-axis displays the items. Y-axis displays the values.
The kinds of line graphs are Linear, Line with markers, Stacked line, Stacked line with markers and 100% stacked line. The following are the samples.
Linear

Line with markers
Displays the values with markers

Stacked line
Shows each item’s contribution rate to the total value.

Stacked line with markers
With markers, shows each item’s contribution rate to the total value.

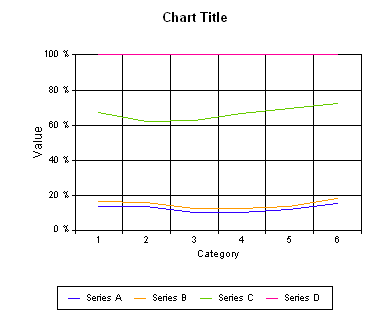
100% stacked line
Shows trends over a period of time in percentage.
